Data in Real Estate Industry
Being an owner of 4 investment properties, in hunt for 5th, I have applied some of these strategies and have successfully employed them, this article covers various different aspects of applying data science principles in real estate to help you find your next dream home or help you find your next investment
Introduction
Data is used in stock investment in a lot of situation but similar concepts can be applied to Data in real estate industry to understand underpriced and overpriced suburbs.
In Boston, the price of homes within a quarter of a mile of a Starbucks jumped by more than 171 percent between 1997 and 2014, 45 percentage points more than all homes in the city, according to a February 2015 report by the brokerage and information website Zillow.
Over the past decade, Seattle apartment buildings within a mile of specialty grocery stores like Whole Foods and Trader Joe’s appreciated in value faster than others.
While the impact of proximity might be intuitive, home prices are not just driven by having nearby grocery stores. Rather, they are driven by access to the right quantity, mix, and quality of community features.
More is not always better; this is true because two specialty food stores within a quarter of a mile correlated with an increase in property prices but having more than four of them within that same distance correlated with lower prices.
These nonlinear relationships are observed across many American cities. And the sweet-spot intersection of density and proximity to community amenities varies among cities and even neighbourhoods, obscured by a growing mass of data that is increasingly difficult to tame.
Too much data can be overwhelming if you do not have the right tools to manage and interpret it especially in real estate.
This article shows what you should be using and how you should go about looking at investing into your next home or buying your investment property.
What are some ways that data can be applied real estate industry can be applied?
Use infographics and correlate with data in real estate industry with country/city
Real estate is not just about what a property is worth today, but how the market will change in the future. Being able to predict ups and downs in values allows both real estate agents and owners to plan out their moves and prepare for whatever may happen in the months and years to come. More data related to real estate industry.
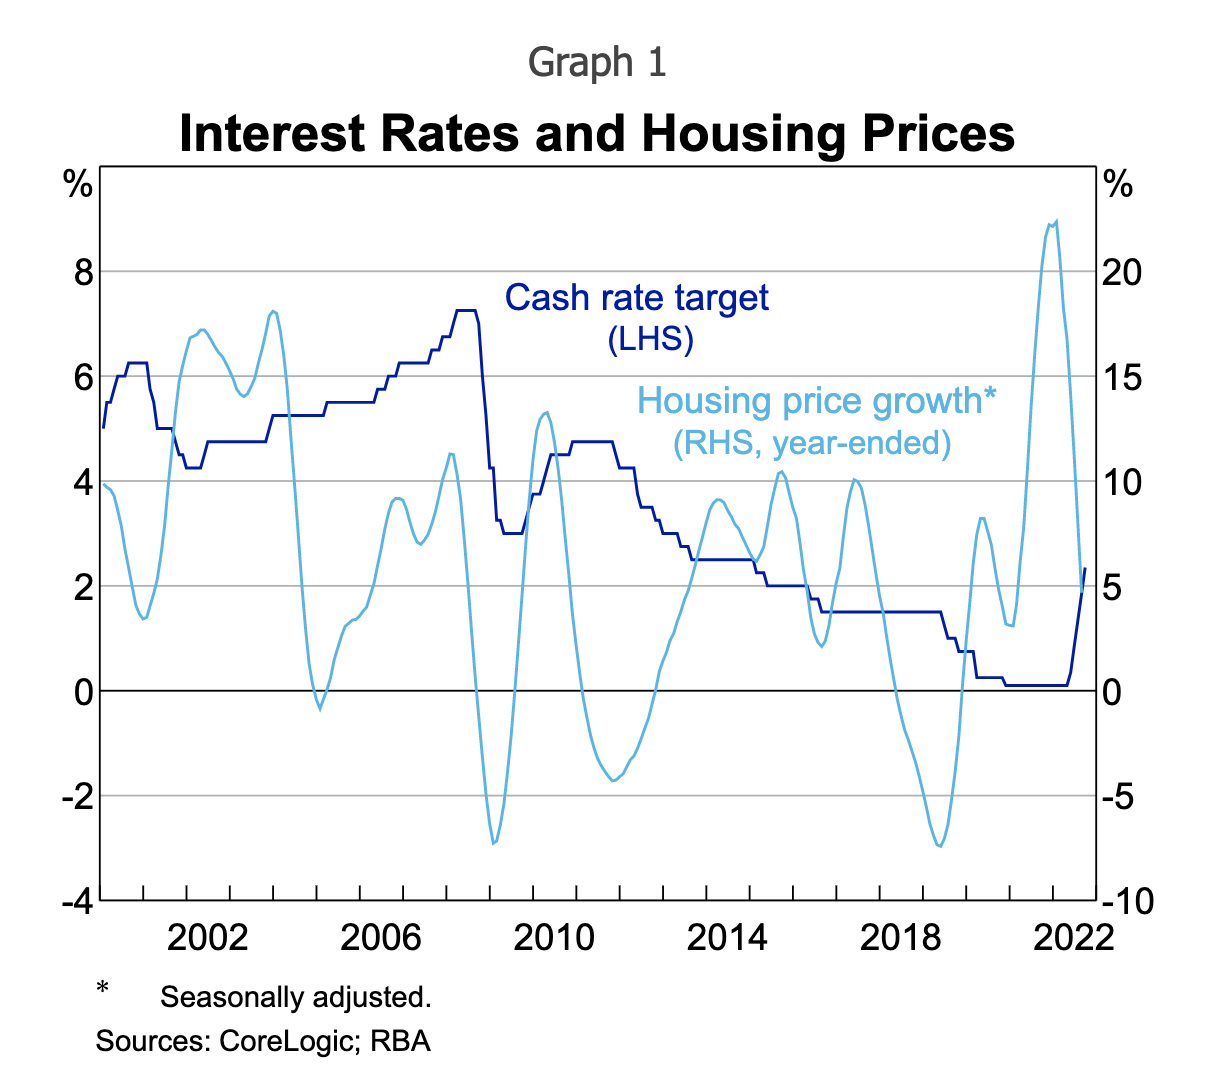
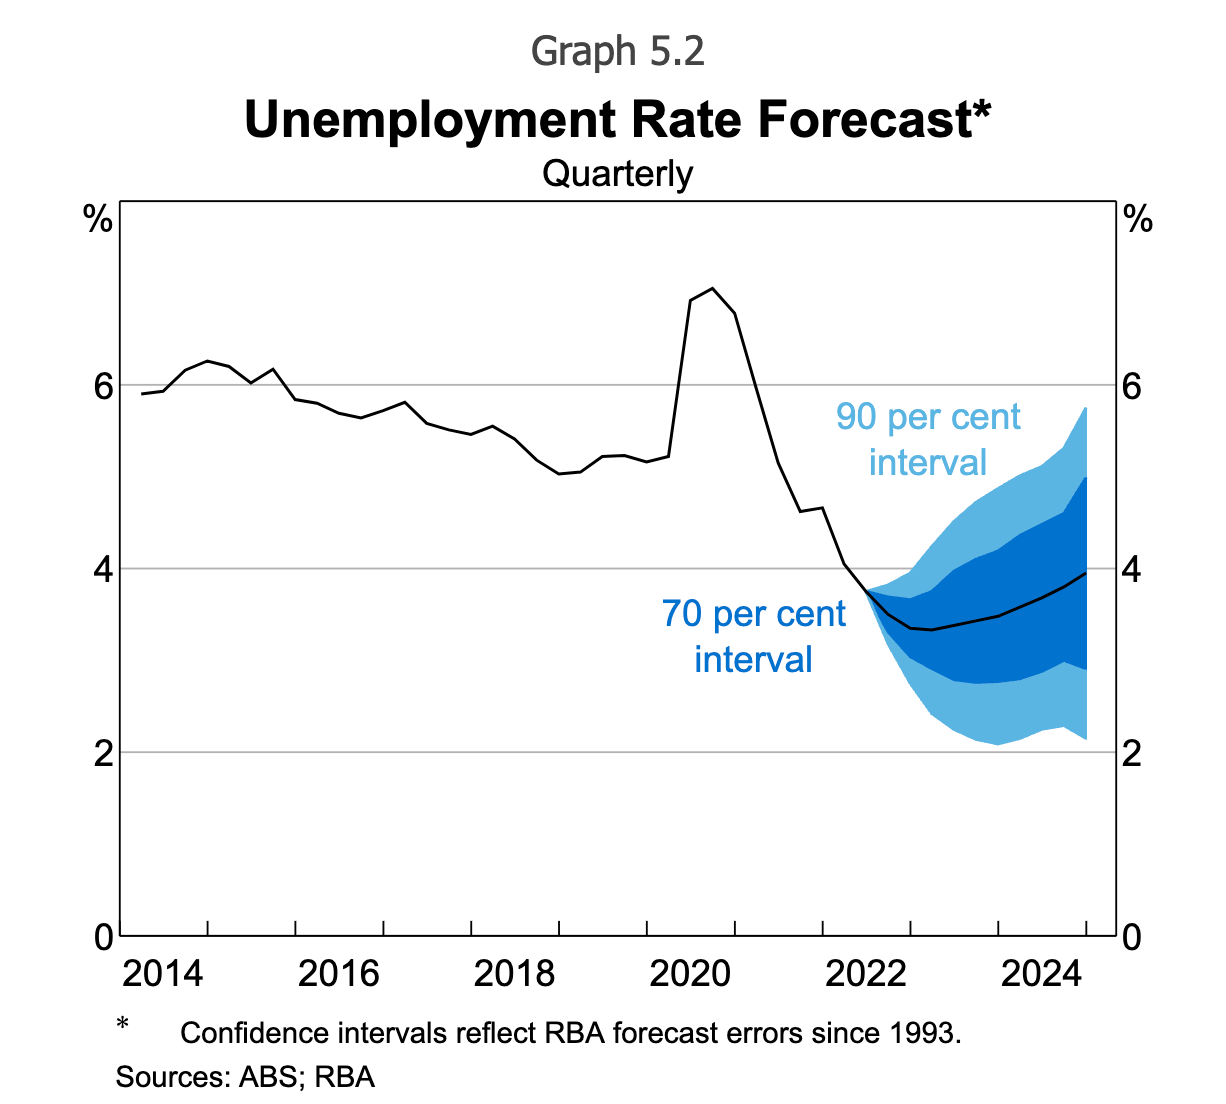
Projections for the real estate market can be influenced by everything from interest rates to levels of unemployment to overall population growth and demand.
Currently we are going through increased interest rates cycle but the level of unemployment is not high, population growth is stable but not much growth due to less immigration but you can use various websites based on your country and figure out where in the cycle of interest rates and unemployment are you?
Some graphs to look at as shown below for Australian market


Get property value using web-scraper providing data in real estate industry
It takes years of experience as well as lots of local knowledge to get the right value for real estate. Mistakes can be made, which is bad for clients and worse for your agencies reputation. There are large data sets relating to property transactions in each region, and this provide property price indices upon which future valuations can be based. This goes much deeper than just analysing historical sale prices. It is possible to quash data disorganisation and improve visibility of key insights by using platforms like northspyre.com if you are based in United States or you can use onthehouse.com.au .
When automation comes into play, it means that valuations can be generated by software. This underpins many modern property platforms.
Though the data in real estate industry will vary from home to commercial but you can still use a tool which will provide that information on the valuation of the property.
For example, I created a web-scraper which was able to scrape through data in real estate industry (houses) value from www.onthehouse.com.au but last I checked, it was still working, you can re-use the code and get the property value.
If you are based in United states, I recommend making your own web-scraper or even buying one of the API access to get the information like for Zillow which provides a lot of data in real estate. These kind of datasets and data in real estate industry can be useful.
Identify patterns and singling out anomalies seen in the data in real estate industry suburb or area that you are in
Once a pattern has been found, it is up to the data scientist to determine what this means and how this should affect decision-making according to the context.
A better understanding of how certain assets are to be interpreted is required for data in real estate industry.
Even within a single neighbourhood there will be fluctuations in property values and saleability according to the category of property that’s being considered. Even if the location is virtually the same, affordable housing might be different from high end apartments.
Attached is an example of a notebook which provides a way to get information on how to get that
https://www.kaggle.com/code/serigne/stacked-regressions-top-4-on-leaderboard
Data science can set apart and assess the commercial properties market. It is called cluster analysis and it means that models for each category of property are developed so that realtors can better adapt their tactics for courting sellers and buyers alike.
Insights from geographic information system to provide insights for data in real estate
It is impossible to handle a torrent of information manually in the world of real estate, because location matters more than almost anything else.
It is possible to look into things like public amenities, crime rates, transport links, average household incomes, and so on using data science tools and strategies.
There is a lot public data sets available to find out information on geographical and demographical data like how far a particular suburb is from the centre, what sort of crime rate does it has, what are the professions that are in the suburb etc, to figure out whether the suburb is under or over priced.
ABS census data
Residential and commercial real estate can be dealt with using an informed overview.
Auction and Property Real Estate Industry Data to figure out if there are underpriced properties
I had created a Github project which will get all the auction results over the weekend for a suburb and than will look at the property value from onthehouse which is a market valuation website, it worked really well and was able to guide me to bargains which were in Melbourne, so that can be used across the board and can bring a lot of value. I actually got an inspiration from this notebook about carsales and decided to make my own webscraper.
https://github.com/aksdeep/scraper_realestate
Cluster properties into groups based on suburbs
Understand similar performance of asset class: Type of houses, Prices for type of houses, nearby locations and hotspots, High Level Residential and Commercial real estate.
Perform a PCA (Principal component analysis) to figure out the types of properties and where they sit in the cluster whether they are highly priced or lowly priced
Use website data available to you to your advantage
From my website, you can get all the data you need for radius within 10km of Melbourne, 20km or simply let the imagination run wild and set it up and go.
Anything within 10–20km with a particular median price is advantage to you, you should use that information to your advantage and figure out the costs for the property within those radius.
Example: https://www.yourinvestmentpropertymag.com.au/expert-insights/brett-warren/these-are-the-most-affordable-suburbs-within-10km-of-each-cbd
Read top forecaster reports
From my website, you can get all the data you need for radius within 10km of Melbourne, 20km or simply let the imagination run wild and set it up and go.
Anything within 10–20km with a particular median price is advantage to you, you should use that information to your advantage and figure out the costs for the property within those radius.
Listen to BadA*s Real Estate Podcasters
From my website, you can get all the data you need for radius within 10km of Melbourne, 20km or simply let the imagination run wild and set it up and go.
Anything within 10–20km with a particular median price is advantage to you, you should use that information to your advantage and figure out the costs for the property within those radius.
https://www.biggerpockets.com/podcasts/real-estate
Apply your learnings from data and implement it
I have made the mistakes heaps of times, but if your gut says go for it. GO for it, you know what you really want and sometimes you might think you got it little bit over price, but it will pay off — Think of long term Capital Gains and understand each suburbs long term capital gains, it is not always about best rental yield and returns, you have to think of overall demand and you could get 10% rental yield but still have opportunity cost of 3% with 7% inflation but you could have 3% rental yield and 5% compounded growth which will be much better than 10% rental yield with 0% growth (Power of Compounding) in the longer run over 2-3 years.
Final thoughts
Most people will not even know that data science is being used in real estate because of how seamless it is.
If you enjoyed this blog, we encourage you to:
Follow us on here on medium at Akashdeep Singh
For more data news and more information follow us on our website www.datatabloid.com

