

This article data science blogthon.
prologue
With the increasing use of technology, connected smart devices are accumulating data faster than ever before. These devices continuously collect and transmit data that can be processed, transformed and stored for later use. This collected data, called big data, contains valuable insights that can be leveraged across industries to solve real-world problems. However, while this data may be structured or semi-structured, it may be very unstructured in its original form. Processing raw data is often difficult, manual error-prone, time consuming, and expensive due to high-end resources. Therefore, companies are looking for automated solutions that can process large amounts of data in significantly less time.
exploratory data analysis
The most important step in data processing is data exploration using exploratory data analysis (EDA). Various steps are taken to prepare and format the raw data depending on the end goal (regression or classification). This process involves evaluating available data in all directions to identify correlations between different features and targets. It also includes identifying and dealing with data discrepancies such as redundancies, missing values, and outliers. Most organizations employ Python and R programming to process acquired data. Therefore, several open source packages have been developed to automate his EDA process in these two programming languages. These libraries help a data scientist perform his EDA faster and spend more time on model development tasks. R beginners can also use these libraries because they are easy to use and help you quickly understand datasets in a few lines of code.
This article describes the three AutoEDA R libraries and their respective code for running EDA. These R packages efficiently summarize data into tables, prepare detailed HTML reports, and perform several EDA tasks to speed up the process of exploring new datasets.
AutoEDA package for R
Let’s take a look at all three Automated Exploratory Data Analysis packages. Use the Motor Trend Car Road Tests dataset ‘mtcars’ from the available built-in R datasets. To load and display this dataset, use –
#load dataset
df = mtcars
head(df)
1. Data Maid
The dataMaid package produces reports in various formats such as PDF, DOCX and HTML. The generated report checks the dataset and summarizes it concisely. A great tool for checking datasets for errors.
Install, import, and run the dataMaid package with the following commands:
# Install package
install.packages("dataMaid")
# Import library
library(dataMaid)
# Create report
makeDataReport(df, output = "html", replace = TRUE)
From the above .gif of the .html report generated by the dataMaid package, you can see that all discrepancies in the dataset are summarized by variable in the generated report. This makes it easier for you to understand the quality of your data and determine the next steps required to clean your data.
of dataMaid package documentation Additional details can be found.
2. Data Explorer
This is one of the most commonly used AutoEDA packages for R. DataExplorer simplifies the EDA process and report generation. This library provides many useful functions for automatically scanning datasets for variables, performing data profiling, and creating various charts on both discrete and continuous features in datasets. .
Let’s look at the code required to install and use the DataExplorer library.
# Installing the package
install.packages("DataExplorer")
# Importing the library
library(DataExplorer)
create_report(mtcars)
data()
The DataExplorer library uses the create_report function to generate a complete HTML report in the dataset’s EDA working directory. This function also accepts additional arguments to customize the EDA report. The HTML file for the report looks like this when opened in a browser:
From the .gif image of the report above, you can see that the table of contents presents a comprehensive report covering most tasks performed during EDA generated with just one line of code. A portion of a sample plot from the report is shown below.
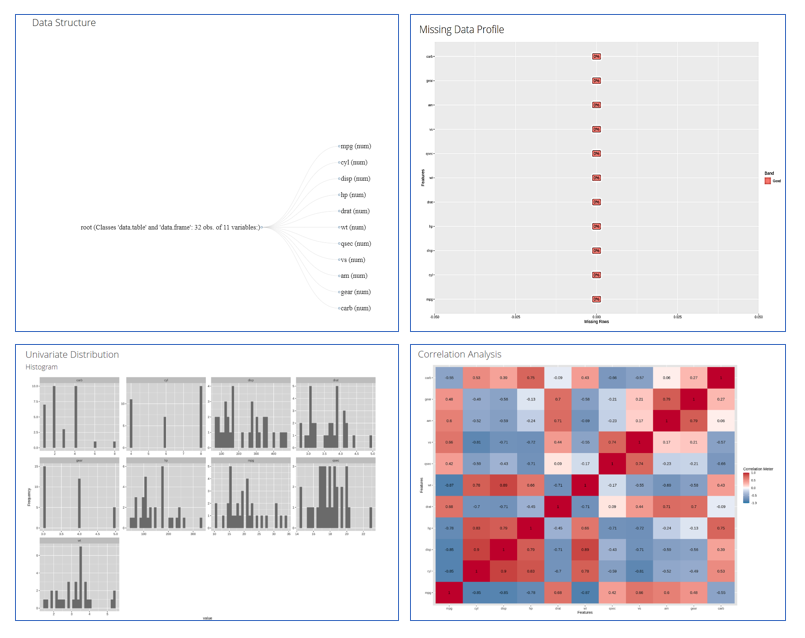
You can also refer to package documentation For more information, visit the CRAN-R website
3. Smart EDA
The next AutoEDA library is SmartEDA. This is a powerful package for automating most EDA tasks through descriptive statistics, data visualization, custom tables, and HTML reporting capabilities.
Like the previous DataExplorer package, the SmartEDA library also allows you to generate full HTML reports using the ExpReport function. Install and import the package and run the ExpReport function to run his EDA as shown below.
# Install package
install.packages("SmartEDA")
# Import library
library(SmartEDA)
ExpReport(df,op_file="smartEDA.html")
This ExpReport function accepts several arguments to customize the report such as template, op_file, op_dir, labels and themes.
Here we use the “op_file” function to name the report.html file. This report file is located in the working directory with the specified name and can be opened in a browser. The .html report snippet shown below provides information on how well the SmartEDA package summarized the ‘mtcars’ dataset.
Below are some sample plots from the report.
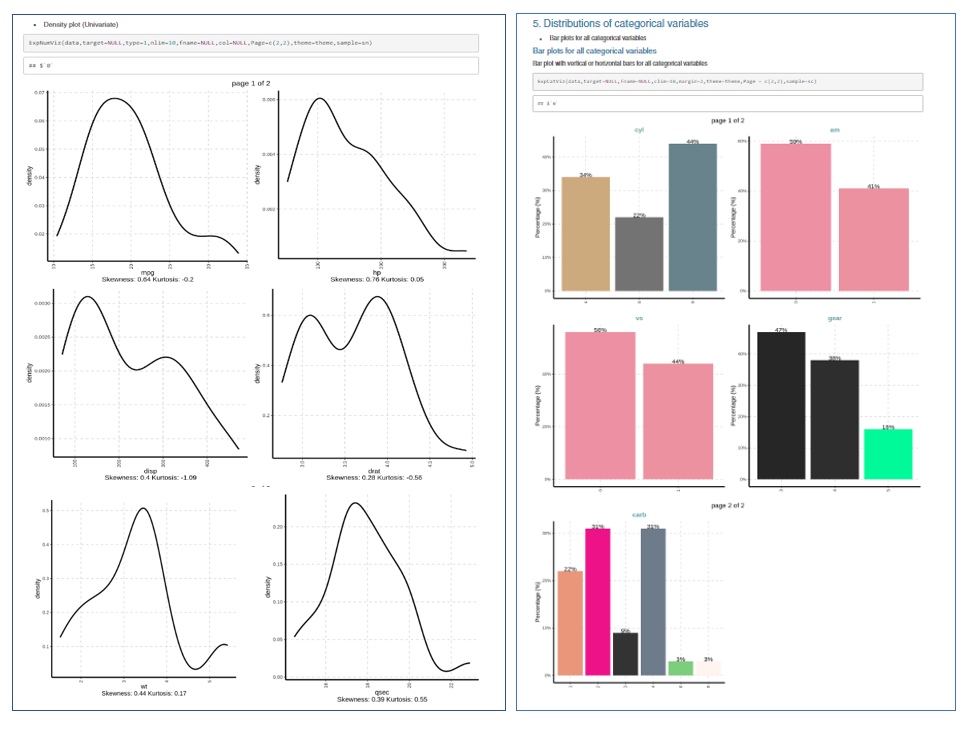
You can see from the .html report that it contains multiple plots generated with just one line of code. These plots help us understand the dataset better. The SmartEDA documentation can be found here: here.
Conclusion
This article covered three different AutoEDA R packages. Overall, these R packages are similar in that they provide the big picture and help improve the general understanding of datasets. You can also manually summarize these reports. According to different purposes, you can choose the right package to apply. For example, the DataMaid package is great at identifying errors in your data. In contrast, the DataExplorer library provides detailed information about datasets through plots such as feature importance, correlation matrices, and missing data plots. The SmartEDA package, on the other hand, is a great tool for understanding multivariate relationships in datasets.
Here are some key points from the article –
- Manual data processing of big data requires a lot of time, money and effort.
- Companies like to automate data processing tasks to speed model building and deployment.
- Automated EDA helps expedite data analysis. Therefore, several open source packages for Python and R are available to automate EDA.
- All three R packages − data maid, data explorer, When Smart EDAcan be very effective in performing EDA on a given dataset and can be considered for implementation by data scientists within your organization.
- These libraries require a few lines of code to perform EDA, so even R beginners can try the libraries described in this article to improve their skills.
I hope you like the article. Try one of these AutoEDA packages to quickly discover interesting insights in a few lines of code for your next R project.
Media shown in this article are not owned by Analytics Vidhya and are used at the author’s discretion.